Catalina Martinez, from IIP - Madrid recently published in OECD's STI working paper series a document titled insight into different types of patent families" containing an exaustive overview of the different patent families definitions, an impact analisys of adopting one definition or another and a deep numeric analisys based on patstat.
One citation: "most definitions will give the same results for 75% of the families. In particular, equivalents, single-priority families and extended patent families will effectively provide the same results for families characterised by one single parent and direct subsequent filings."

Friday, April 30, 2010
Friday, April 23, 2010
Investigating patstat through application numbers
When investigating patstat by application number / application office, we soon come to a problem 'cause this pair is not a unique identifier.
FI if we would look into espacenet for application number 143781 we would get the following 7 results:
Still nothing bad, a part from the fact that when investigating the espacenet application numbers, in many cases the application year (and occasionaly a 0) is added; so if you look for patstat BE 143781 (that is BE814393 in above example) you'll find in espacenet web page
Application number: BE19740143781 19740430
But having a deeper look into the results we will discover that we have 5 hits for USPTO, that means (using the same mechanism)
US19930143781 19931101
US19880143781 19880114
US19610143781 19611009
US19370143781 19370520
US19170143781 19170122
so at what extent duplication of application is spread?
by running a simple query like the one below we may get some results...
Select
patstat.tls201_appln.APPLN_AUTH,
patstat.tls201_appln.APPLN_NR,
Count(patstat.tls201_appln.APPLN_ID) As appcount
From
patstat.tls201_appln
Group By
patstat.tls201_appln.APPLN_AUTH, patstat.tls201_appln.APPLN_NR
Having
Count(patstat.tls201_appln.APPLN_ID) > 1
What we get is that out of a table counting 63.595.305 applications, 5.805.769 are duplicated.
How... lets aggragate a bit the results....
(the lucky application with 9 occurrence is TW85219019)
Obviously by multipling the count of duplications for the number of occurrences we get
11.697.081 applications involved in the issue...
Splitting by country and comparing it to the total number of applications by country we get that the distribution varies a lot from country to country: from the 0,03 of CN or 0,06 of EP up to the 50.73 % of SE
From table have been excluded 9779 applications from 86 lesser patent offices that have no duplications.
Thanks also to Elena Verdolini for rising and helping investigating this issue.
FI if we would look into espacenet for application number 143781 we would get the following 7 results:
| 1 Molding for a front glass Publication info: US5553428 (A) - 1996-09-10 2 Display tab for overwrapped package Publication info: US4779733 (A) - 1988-10-25 3 Welding socket for thermoplastic materials, method and apparatus for its manufacture. Publication info: DK143781 (A) - 1981-10-01 4 WIRBELBETTVERFAHREN ZUR DURCHFUEHRUNG VON ENDOTHERMEN CHEMISCHEN UND/ODER PHYSIKALISCHEN PROZESSEN Publication info: BE814393 (A1) - 1974-08-16 5 Information handling apparatus Publication info: US3248560 (A) - 1966-04-26 6 Magnetic unit Publication info: US2163161 (A) - 1939-06-20 7 System of gas control Publication info: US1348379 (A) - 1920-08-03 | |||||||||||||
Application number: BE19740143781 19740430
But having a deeper look into the results we will discover that we have 5 hits for USPTO, that means (using the same mechanism)
US19930143781 19931101
US19880143781 19880114
US19610143781 19611009
US19370143781 19370520
US19170143781 19170122
so at what extent duplication of application is spread?
by running a simple query like the one below we may get some results...
Select
patstat.tls201_appln.APPLN_AUTH,
patstat.tls201_appln.APPLN_NR,
Count(patstat.tls201_appln.APPLN_ID) As appcount
From
patstat.tls201_appln
Group By
patstat.tls201_appln.APPLN_AUTH, patstat.tls201_appln.APPLN_NR
Having
Count(patstat.tls201_appln.APPLN_ID) > 1
What we get is that out of a table counting 63.595.305 applications, 5.805.769 are duplicated.
How... lets aggragate a bit the results....
| count of duplications | count of appl # |
| 2 | 5721284 |
| 3 | 83472 |
| 4 | 979 |
| 5 | 29 |
| 6 | 1 |
| 7 | 3 |
| 9 | 1 |
| Total count: | 5805769 |
(the lucky application with 9 occurrence is TW85219019)
Obviously by multipling the count of duplications for the number of occurrences we get
11.697.081 applications involved in the issue...
Splitting by country and comparing it to the total number of applications by country we get that the distribution varies a lot from country to country: from the 0,03 of CN or 0,06 of EP up to the 50.73 % of SE
| appln auth | # of duplicated ap nr | total # of applications | % |
| AM | 2 | 147 | 1,36% |
| AP | 12 | 4742 | 0,25% |
| AR | 408 | 79581 | 0,51% |
| AT | 6334 | 1028408 | 0,62% |
| AU | 683801 | 1553990 | 44,00% |
| BA | 44 | 344 | 12,79% |
| BE | 4639 | 642989 | 0,72% |
| BG | 11611 | 53602 | 21,66% |
| BR | 58551 | 496326 | 11,80% |
| BY | 20 | 761 | 2,63% |
| CA | 2390 | 2580140 | 0,09% |
| CH | 8672 | 1055204 | 0,82% |
| CL | 10 | 4453 | 0,22% |
| CN | 826 | 2803867 | 0,03% |
| CS | 1765 | 166312 | 1,06% |
| CU | 26 | 2843 | 0,91% |
| CY | 2 | 2621 | 0,08% |
| CZ | 5617 | 66921 | 8,39% |
| DD | 8937 | 266209 | 3,36% |
| DE | 1506427 | 6792342 | 22,18% |
| DK | 12118 | 429570 | 2,82% |
| EA | 32 | 13114 | 0,24% |
| EC | 2 | 4949 | 0,04% |
| EE | 1298 | 6251 | 20,76% |
| EG | 160 | 11450 | 1,40% |
| EM | 4 | 4254 | 0,09% |
| EP | 1441 | 2388584 | 0,06% |
| ES | 195371 | 902689 | 21,64% |
| FI | 20051 | 271371 | 7,39% |
| FR | 104899 | 2917043 | 3,60% |
| GB | 133141 | 3319126 | 4,01% |
| GR | 194 | 97444 | 0,20% |
| GT | 4 | 1301 | 0,31% |
| HK | 34 | 69450 | 0,05% |
| HR | 154 | 11297 | 1,36% |
| HU | 17796 | 137061 | 12,98% |
| IB | 8 | 65369 | 0,01% |
| ID | 4561 | 14768 | 30,88% |
| IE | 773 | 91248 | 0,85% |
| IL | 1155 | 160970 | 0,72% |
| IN | 358 | 66238 | 0,54% |
| IS | 57 | 7797 | 0,73% |
| IT | 161988 | 708724 | 22,86% |
| JP | 7567660 | 16282860 | 46,48% |
| KE | 28 | 1392 | 2,01% |
| KR | 279459 | 1659443 | 16,84% |
| KZ | 4 | 477 | 0,84% |
| LT | 22 | 3651 | 0,60% |
| LU | 34 | 68491 | 0,05% |
| LV | 26 | 4835 | 0,54% |
| MA | 4 | 10092 | 0,04% |
| MC | 682 | 2789 | 24,45% |
| MD | 554 | 4586 | 12,08% |
| MK | 2 | 87 | 2,30% |
| MN | 12 | 246 | 4,88% |
| MX | 1262 | 162007 | 0,78% |
| MY | 26 | 11106 | 0,23% |
| NL | 17313 | 607873 | 2,85% |
| NO | 1610 | 226939 | 0,71% |
| NZ | 30 | 109638 | 0,03% |
| OA | 100 | 12934 | 0,77% |
| PE | 8 | 431 | 1,86% |
| PH | 339 | 23261 | 1,46% |
| PL | 2263 | 233730 | 0,97% |
| PT | 112 | 81034 | 0,14% |
| RO | 472 | 61095 | 0,77% |
| RU | 2117 | 394084 | 0,54% |
| SE | 421795 | 831377 | 50,73% |
| SG | 595 | 51063 | 1,17% |
| SI | 235 | 17619 | 1,33% |
| SK | 614 | 23261 | 2,64% |
| SU | 3977 | 1249050 | 0,32% |
| TR | 837 | 42800 | 1,96% |
| TT | 2 | 52 | 3,85% |
| TW | 2956 | 369739 | 0,80% |
| UA | 748 | 50213 | 1,49% |
| US | 434521 | 11376401 | 3,82% |
| UY | 66 | 6573 | 1,00% |
| VN | 8 | 240 | 3,33% |
| WO | 39 | 5065 | 0,77% |
| XH | 2 | 1242 | 0,16% |
| YU | 91 | 33687 | 0,27% |
| ZA | 749 | 256542 | 0,29% |
| ZM | 4 | 2742 | 0,15% |
| ZW | 10 | 2909 | 0,34% |
From table have been excluded 9779 applications from 86 lesser patent offices that have no duplications.
Thanks also to Elena Verdolini for rising and helping investigating this issue.
Wednesday, April 14, 2010
Counting patstat patents by application year
Here below a small table created by counting by application year patents applied @ EPO vs patents applied @ USPTO. Data have been counted from september 2009 data, starting from 1980.
Note that the peak is in 2004 for US and 2006 for EPO due to the examination lag (for both office) and also to the delay in including Us patents in patstat, for USPTO.
Nota also that 2001 sudden rise of 100% of patent count for USPTO is due to a change in the US Patent Law, since US Patent and Trademark Office was obliged to publish patent applications from 29 November 2000. However USPTO internal publishing system meant that publication actually began in March 2001.
Here below a graph showing the differences...

Note that the peak is in 2004 for US and 2006 for EPO due to the examination lag (for both office) and also to the delay in including Us patents in patstat, for USPTO.
Nota also that 2001 sudden rise of 100% of patent count for USPTO is due to a change in the US Patent Law, since US Patent and Trademark Office was obliged to publish patent applications from 29 November 2000. However USPTO internal publishing system meant that publication actually began in March 2001.
| appl year | EPO pat# | USPTO pat# |
| 1980 | 19724 | 67106 |
| 1981 | 24959 | 64458 |
| 1982 | 28522 | 65614 |
| 1983 | 31609 | 62165 |
| 1984 | 36952 | 67690 |
| 1985 | 39375 | 72161 |
| 1986 | 43083 | 75925 |
| 1987 | 45817 | 82387 |
| 1988 | 52186 | 91028 |
| 1989 | 57727 | 97146 |
| 1990 | 63907 | 100332 |
| 1991 | 59280 | 101194 |
| 1992 | 60626 | 104798 |
| 1993 | 60066 | 109216 |
| 1994 | 62005 | 124374 |
| 1995 | 65308 | 145762 |
| 1996 | 71413 | 146351 |
| 1997 | 80488 | 172249 |
| 1998 | 90974 | 175349 |
| 1999 | 98718 | 193052 |
| 2000 | 109395 | 229731 |
| 2001 | 115110 | 428829 |
| 2002 | 112839 | 443539 |
| 2003 | 115652 | 458809 |
| 2004 | 120813 | 490649 |
| 2005 | 126739 | 488568 |
| 2006 | 129292 | 404225 |
| 2007 | 112413 | 328202 |
| 2008 | 35728 | 183275 |
| 2009 | 2909 | 13271 |
Here below a graph showing the differences...

Friday, April 9, 2010
Chinese patents data coverage in PATSTAT
Following my recent post about chinese patents data, I had a a deeper look into SIPO (chinese patent office) and organized data by year (see table below) and compared them against PATSTAT 10/2009 data.
We can understand that, leaving aside designs, that data coverage is usually over 90% on applied patents.
The delusion comes from the quality of data coverage...
When examining the applicants data out of 776607 applicant none has a zip code or a city.
Only 3161 have an address (where address city zip are packed altogether) but all of them are non-chinese.
So no geographic analisys is possible.
One more thing to be careful about are counts by publication numbers: FI if you look for patent # CN1237182 you will find 2 different patents: the first with status A (unexamined) and the latter with status C (granted).
So we should clarify the meaning of Publication number. According to SIPO, there is more than one kind of publication numbers which are reflected by the Kind Code:
Last but not least: IPCs.
Out of 3.270.000 published patents 1.136.000 have no indication of primary ipc class.
So we're going to use data straight from SIPO to build a chinese patents database...
(bytheway, if you are willing to search into sipo website, this is the link to english search page:
http://218.240.13.210/sipo_EN/search/tabSearch.do?method=init )
We can understand that, leaving aside designs, that data coverage is usually over 90% on applied patents.
| Year | Total | Inv + utility | Invention | Utility Model | Design | PATSTAT | % coverage |
| 1985 | 14.372 | 13.732 | 8.558 | 5.174 | 640 | 12.532 | 91,26 |
| 1986 | 18.509 | 17.682 | 8.009 | 9.673 | 827 | 15.992 | 90,44 |
| 1987 | 26.077 | 24.765 | 8.059 | 16.706 | 1.312 | 22.411 | 90,49 |
| 1988 | 34.011 | 32.052 | 9.652 | 22.400 | 1.959 | 27.388 | 85,45 |
| 1989 | 32.905 | 30.386 | 9.659 | 20.727 | 2.519 | 27.215 | 89,56 |
| 1990 | 41.469 | 37.752 | 10.137 | 27.615 | 3.717 | 32.090 | 85,00 |
| 1991 | 50.040 | 44.705 | 11.423 | 33.282 | 5.335 | 37.713 | 84,36 |
| 1992 | 67.135 | 58.778 | 14.409 | 44.369 | 8.357 | 48.832 | 83,08 |
| 1993 | 77.276 | 67.117 | 19.618 | 47.499 | 10.159 | 54.916 | 81,82 |
| 1994 | 77.735 | 64.578 | 19.067 | 45.511 | 13.157 | 57.315 | 88,75 |
| 1995 | 83.045 | 65.377 | 21.636 | 43.741 | 17.668 | 60.224 | 92,12 |
| 1996 | 102.735 | 78.121 | 28.517 | 49.604 | 24.614 | 67.837 | 86,84 |
| 1997 | 114.208 | 83.795 | 33.666 | 50.129 | 30.413 | 73.285 | 87,46 |
| 1998 | 121.989 | 87.357 | 35.960 | 51.397 | 34.632 | 79.939 | 91,51 |
| 1999 | 134.239 | 94.186 | 36.694 | 57.492 | 40.053 | 91.110 | 96,73 |
| 2000 | 170.682 | 120.562 | 51.747 | 68.815 | 50.120 | 112.283 | 93,13 |
| 2001 | 203.573 | 142.926 | 63.204 | 79.722 | 60.647 | 132.884 | 92,97 |
| 2002 | 252.631 | 173.371 | 80.232 | 93.139 | 79.260 | 165.357 | 95,38 |
| 2003 | 308.487 | 214.433 | 105.318 | 109.115 | 94.054 | 204.918 | 95,56 |
| 2004 | 353.807 | 242.958 | 130.133 | 112.825 | 110.849 | 234.252 | 96,42 |
| 2005 | 476.264 | 312.893 | 173.327 | 139.566 | 163.371 | 286.538 | 91,58 |
| 2006 | 573.178 | 371.856 | 210.490 | 161.366 | 201.322 | 337.228 | 90,69 |
| 2007 | 693.917 | 426.485 | 245.161 | 181.324 | 267.432 | 354.732 | 83,18 |
| 2008 | 828.328 | 515.424 | 289.838 | 225.586 | 312.904 | 255.837 | 49,64 |
The delusion comes from the quality of data coverage...
When examining the applicants data out of 776607 applicant none has a zip code or a city.
Only 3161 have an address (where address city zip are packed altogether) but all of them are non-chinese.
So no geographic analisys is possible.
One more thing to be careful about are counts by publication numbers: FI if you look for patent # CN1237182 you will find 2 different patents: the first with status A (unexamined) and the latter with status C (granted).
So we should clarify the meaning of Publication number. According to SIPO, there is more than one kind of publication numbers which are reflected by the Kind Code:
‘A’: Publication of Unexamined application for patent for invention
‘C’: Publication of Granted patent for Invention
‘Y’: Publication of Granted patent for Utility Model
‘D’: Publication of Granted patent for Design
Last but not least: IPCs.
Out of 3.270.000 published patents 1.136.000 have no indication of primary ipc class.
So we're going to use data straight from SIPO to build a chinese patents database...
(bytheway, if you are willing to search into sipo website, this is the link to english search page:
http://218.240.13.210/sipo_EN/search/tabSearch.do?method=init )
Sunday, April 4, 2010
IPC: core vs advanced level in patstat
As very vell explained from EPO website (here) IPC classification contains over 70.000 entries, that give too much detail for most users.
That's the reason why aside from this advanced classification has been introduced a core classification containing "only" 20.000 entries.
The advanced level is a superset of the core level, ie it consists of all core level groups and many finer subdivisions, allows updates to be made every three months, which means it will grow considerably in the years ahead.
In PCT minimum documentation have an advanced-level IPC. They also have a core level IPC that is derived from the advanced level.
In patstat we can distinguish advanced and core levels by the content (A or C) of field IPC_CLASS_LEVEL in table tls209_appln_ipc.
I ran a query in order to understand how A & C IPCs are distributed across the various patent offices (see the SQL below) expecting a 1:1 distribution.
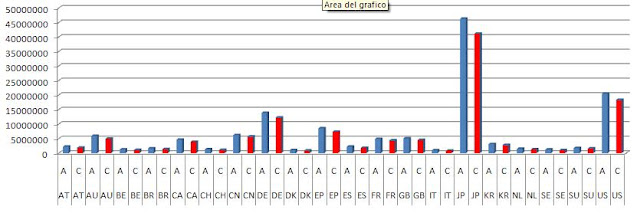
At a glance we notice that, apart from Slovenia Patent office (SI), everywhere the figure of advanced IPCs is the higher, average above 10%.
The peak of difference is to be found in some african countries (34% Kenia, 36% Malawi) but also in Iceland advanced ipcs are 31% more than core ones. Same trend in US (11%), EP (15%) and JP (12%).
That's the reason why aside from this advanced classification has been introduced a core classification containing "only" 20.000 entries.
The advanced level is a superset of the core level, ie it consists of all core level groups and many finer subdivisions, allows updates to be made every three months, which means it will grow considerably in the years ahead.
In PCT minimum documentation have an advanced-level IPC. They also have a core level IPC that is derived from the advanced level.
In patstat we can distinguish advanced and core levels by the content (A or C) of field IPC_CLASS_LEVEL in table tls209_appln_ipc.
I ran a query in order to understand how A & C IPCs are distributed across the various patent offices (see the SQL below) expecting a 1:1 distribution.
SELECT tls201_appln.APPLN_AUTH, tls209_appln_ipc.IPC_CLASS_LEVEL, COUNT(tls209_appln_ipc.APPLN_ID)The full results of the query may be downloaded here; bytheway I publish here a graph of patenting office with more than 850.000 C and A IPCs: in red you may find the count of CORE ipcs, in blu the ADVANCED ones.
FROM patstat.tls209_appln_ipc
INNER JOIN patstat.tls201_appln ON tls209_appln_ipc.APPLN_ID = tls201_appln.APPLN_ID
GROUP BY tls201_appln.APPLN_AUTH, tls209_appln_ipc.IPC_CLASS_LEVEL
ORDER BY tls201_appln.APPLN_AUTH, tls209_appln_ipc.IPC_CLASS_LEVEL;

At a glance we notice that, apart from Slovenia Patent office (SI), everywhere the figure of advanced IPCs is the higher, average above 10%.
The peak of difference is to be found in some african countries (34% Kenia, 36% Malawi) but also in Iceland advanced ipcs are 31% more than core ones. Same trend in US (11%), EP (15%) and JP (12%).
Subscribe to:
Posts (Atom)